

Witch, our window switching application, is designed to be always-running (what good is a window switcher if it’s not active?). The program itself exists as two components: the user interface, where you modify Witch’s settings, and the background process that watches for the Witch activation keystrokes and builds the list when activated. The background process is named witchdaemon, and some users have emailed us with concerns about the RAM usage of this background daemon.
The emails we receive come in two flavors:
- Why is Witch using so much real RAM?
- Why is Witch reserving gigabytes of virtual memory (VSIZE in top)?
Read on for the details on both real and virtual RAM usage by Witch—the explanations are somewhat detailed and technical (especially relative to virtual memory), so put on your geek glasses before proceeding.
High real RAM usage
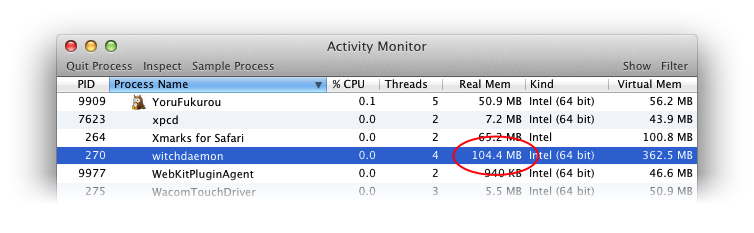
I’ll address real RAM usage first, because it’s both more important and much simpler to understand. To see how much real RAM Witch is using, run Activity Monitor (in Applications > Utilities), click on the Process Name header, and find witchdaemon in the list of processes. Here’s how it looks on my Mac:

The column of interest is Real Mem, and as you can see, it’s only 13.4MB—and the daemon had been running for nine days when I took that screenshot. On your Mac, though, you may see a much different value, and it could be substantially higher; I’ve had reports of RAM usage exceeding 1GB. So why the differences? There are three things that affect the memory usage for witchdaemon:
- The number of windows you’re switching between. Keep more windows open, and generally speaking, witchdaemon will use more RAM.
- The setting of the “Show” pop-up menu in the Appearance tab of Witch’s settings. Set it to ‘application icons’ for the least memory usage; using ‘mini window previews if possible’ will use the most RAM.
- Using window previews, either via the “Pop up a preview of the selected window after a” pop-up menu (also on the Appearance tab of Witch’s settings), or by pressing the Space Bar with a window selected. Show lots of window previews, and RAM usage will increase.
The reason these last two options use RAM is that Witch caches the images, so that future redraws of the panel will be quicker. For instance, here’s my same nine-days-running witchdaemon after I used a slew of window previews:
At present, this cache isn’t cleared aggressively by Witch, though the system will take it if it needs it. Over time, if you use preview icons and/or window previews, you may see witchdaemon‘s memory usage increase. (The system will do some cleanup; my RAM usage fell to 92MB within a minute or so of taking the screenshot.)
The easiest way to reclaim this memory is to simply open the Witch settings panel—this will restart witchdaemon automatically, and thereby clear the cached image data.
High virtual memory usage
If you’re the type of user who likes to really see the nitty gritty on what your machine is up to, you may occasionally use top in Terminal. top is basically like Activity Monitor, but for command line geeks. If you do, and you use Witch, it may freak you out just a bit when you see something like this:
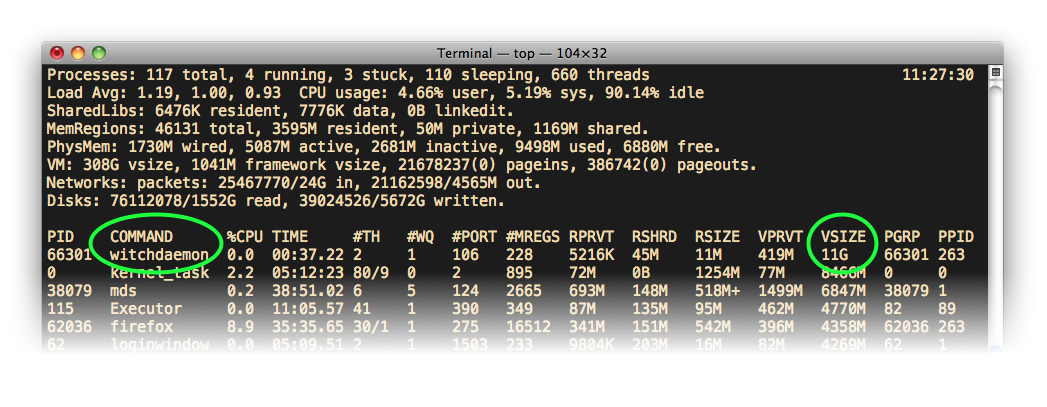
Why on Earth would witchdaemon need 11 gigabytes of VSIZE, whatever that might be? (In Activity Monitor, you can see these VSIZE values, but you must first select a process, then click Inspect; the value is on the Memory tab.)
Regardless of what it VSIZE may be, though, the sheer size of the number is shocking, and probably has you thinking “Geez, Witch is a huge memory hog; that’s horrible!”
As it turns out that this huge figure in VSIZE is nothing to worry about, and it’s not exclusive to Witch. So if you’ve seen it, and wonder if you should care, the answer is you shouldn’t.
If you’re curious as to why you shouldn’t care, then keep reading. (Things are going to get a bit geeky from here on out, so consider yourself warned.)
You’re headed into a maze of twisty little passages, all alike…at least, that’s how I feel when I start discussing OS X and memory management. In short, it’s a very complex and powerful system that generally works very well, but can be really confusing at times. Keep in mind I’m not a programmer (Peter is our founder and programmer) or memory expert, so the following is a semi-educated amateur’s attempt at explaining Witch’s huge VSIZE number, and why you shouldn’t care about it.
The VSIZE column represents the amount of memory ‘marked’ for an application’s potential use. The important bit is that it’s not reserved, protected, or otherwise used; it’s simply marked, as in “Witch may need 11GB of RAM at some point.”
If you look at the VSIZE figures in total, they can be shockingly large. If you look at my screenshot above, there’s a summary at the top; one of the lines summarizes the virtual memory situation:

That 308GB of VSIZE reflects the memory that has been marked as possibly required for my currently running apps—yikes! But the reality is that this amount of memory will never be used or needed. Even more important is that application authors don’t control this VSIZE figure; the system does it itself, based on what the author’s code needs to do. So why is it so big? The honest answer is that I don’t know why, nor seemingly does anyone out there, at least based on some internet searches.
You can, however, see exactly what’s in that huge VSIZE space by using the vmmap tool. Enter this command in Terminal:
vmmap -resident `ps ax | grep [w]itchd | cut -b 1-5` | grep "Summary for" -A 999
That looks complicated, but what it does is run vmmap on the process ID of witchdaemon, and then displays only the summary portion of the output (as there are thousands of lines). The output on my machine is as follows:
==== Summary for process 66301
ReadOnly portion of Libraries: Total=143.7M resident=80.9M(56%) swapped_out_or_unallocated=62.7M(44%)
Writable regions: Total=8.4G written=7248K(0%) resident=30.0M(0%) swapped_out=0K(0%) unallocated=8.4G(100%)

REGION TYPE                      VIRTUAL RESIDENT
===========                      ======= ========
CG backing stores                  9100K    5824K
CG raster data                      228K     192K
CG shared images                   1280K    1256K
CoreGraphics                         16K       8K
CoreServices                       6232K    6232K
IOKit (reserved)                  256.0M       0K        reserved VM address space (unallocated)
MALLOC                            337.2M    6520K        see MALLOC ZONE table below
MALLOC (reserved)                   7.8G       0K        reserved VM address space (unallocated)
MALLOC freed, no zone              72.0M     196K
MALLOC guard page                   104K       0K
MALLOC metadata                     740K     260K
Memory tag=240                        4K       4K
Memory tag=242                       12K      12K
Memory tag=243                        4K       4K
STACK GUARD                        56.0M       0K
Stack                              9752K     116K
VM_ALLOCATE                        16.2M    16.1M
__DATA                             12.1M    9808K
__IMAGE                            1240K     344K
__LINKEDIT                         36.8M    10.9M
__RC_CAMERAS                        248K       0K
__TEXT                            106.9M    70.0M
__UNICODE                           536K     456K
mapped file                        23.3M    8492K
shared memory                     135.8M   111.6M
===========                      ======= ========
TOTAL                               8.8G   247.4M
TOTAL, minus reserved VM space    825.0M   247.4M

                                          VIRTUAL   RESIDENT ALLOCATION      BYTES
MALLOC ZONE                                  SIZE       SIZE      COUNT  ALLOCATED  % FULL
===========                               =======  =========  =========  =========  ======
auto_zone_0x100263000                      256.2M      4240K      17546      1698K      0%
DefaultMallocZone_0x1001d0000               72.0M      2168K       7793      1597K      2%
DispatchContinuations_0x10026c000           8192K        96K          1         32      0%
environ_0x100202000                         1024K        12K          1         16      0%
DefaultPurgeableMallocZone_0x1007d6000         4K         4K          0         0K      0%
===========                               =======  =========  =========  =========  ======
TOTAL                                      337.2M      6520K      25341      3296K      0%
This command shows you the breakdown between what’s marked (VIRTUAL) and what’s being more actively used (RESIDENT). The lines I highlighted in red show three items that take no RESIDENT RAM, but have huge VIRTUAL values. Add them up, and of the 8.8GB in total VSIZE, roughly 8.1GB of it is taken up by things that aren’t using any RAM—and that aren’t controlled by Witch.
The RESIDENT column shows Witch using 247MB of RAM, but that doesn’t seem to be accurate either. To me, the best summary of Witch’s actual memory usage is found in the Inspect panel in Activity Monitor; here’s what it looked like while writing this blog entry:
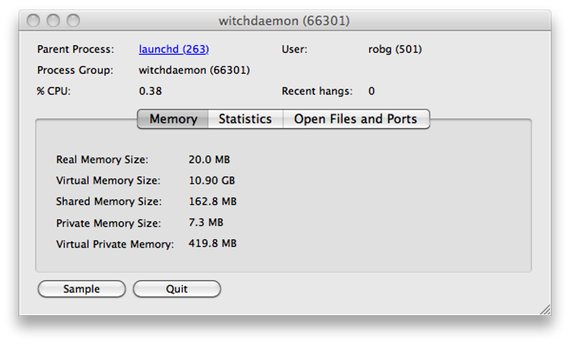
Here you can see that the witchdaemon process is using only 20MB of real memory, has 163MB of shared memory (used for inter-application communication, as I understand it), and has 7MB of private memory. (We are rapidly approaching the limits of my knowledge of OS X’s memory management system, so I’ll stop now!)
In summary, Witch’s VSIZE figure is high. But it’s nothing we’re doing to create it ourselves, and it’s not something we can reduce. The biggest chunk of it, the 7.8GB for MALLOC (reserved), isn’t anything we can remove, as it’s the OS that’s putting it there. Why is it putting it there? Who knows. But here are a couple of related articles that show it’s not a Witch problem:
- Don’t be alarmed by super large VSIZE on OS X — An example of a three-line Ruby program with a 10GB VSIZE value!
- OS X and virtual bloat — This one goes into details on Mozilla’s large VSIZE. There’s some good info in the comments, too.
Finally, Apple’s support article on Using Activity Monitor contains some tips on how to use Activity Monitor to understand memory usage.
Hi there, apologies for using the comments section for something totally unrelated to the post above but your contact link only allows ‘contact’ through mail which I don’t use (I use gmail and I was unable to copy/paste an email adress from the contact link). Does name mangler allow for alternate naming? I.e. I’ve been scanning books and I have a file with all the left hand pages and another with all the right hand pages. Would it be possible using name mangler to number all the Left pages as odd numbers and the right hand ones as even numbers. That way when I merge the files the ‘book’ will be ordered and all I have to do is convert to pdf. Thanks for your help.